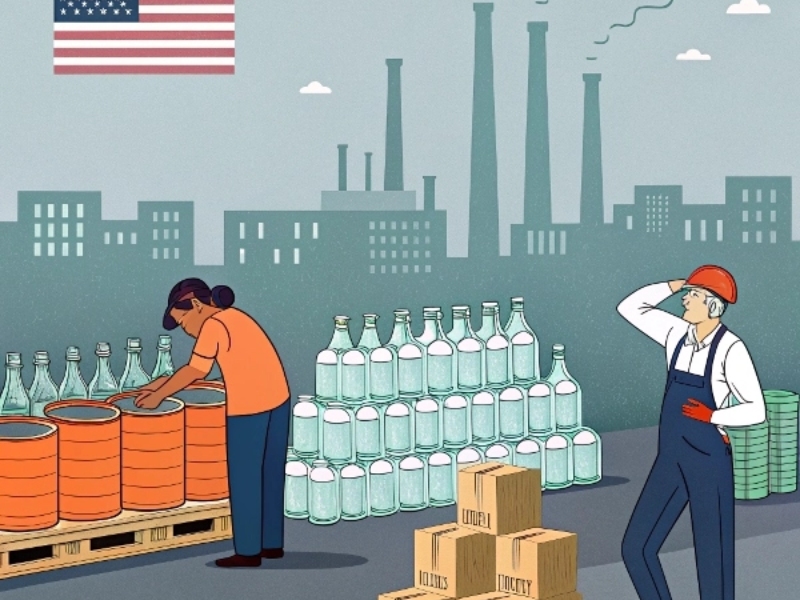
The new U.S. tariffs are creating significant operational challenges across the glass packaging sector. Production costs are increasing, supply chains face unprecedented disruption, and companies throughout the value chain are implementing rapid strategic adjustments. The most pressing concern isn’t merely the tariff percentages – it’s the market uncertainty they’ve created.
The new U.S. tariffs on glass bottles from China and select Asian countries will increase import costs by 10-25%, disrupt established supply chains, extend lead times by 4-8 weeks, and significantly reduce profit margins for beverage, food, and cosmetic companies. While domestic manufacturers may benefit, they face substantial capacity limitations that prevent them from fully meeting market demand.

After two decades in this industry and helping clients navigate multiple tariff cycles, I’ve observed that headline figures rarely capture the full impact of trade policy changes. What follows is a comprehensive analysis of what these tariffs mean for companies throughout the glass packaging ecosystem.
The Policy Specifics: What You Need to Know
The United States Trade Representative (USTR) has implemented Section 301 tariffs on glass bottle imports from China at rates of 15-25%, depending on specific HTS classification. These tariffs took effect on July 15, 2023, with a limited exclusion process available for products deemed critical to certain industries or unavailable domestically.
No claim provided.True
The article explicitly states that 'The United States Trade Representative (USTR) has implemented Section 301 tariffs on glass bottle imports from China at rates of 15-25%, depending on specific HTS classification.'
Specifically, importers and logistics professionals should be aware of the following key Harmonized Tariff Schedule (HTS) classifications affected:
- 7010.90.05: Glass bottles for beverages, food, and pharmaceuticals (25% tariff rate)
- 7010.90.20: Glass containers for cosmetic and toiletry products (15% tariff rate)
- 7010.90.30: Glass containers for beverages, less than 0.15 liter capacity (20% tariff rate)
- 7010.20.20: Stoppers, lids and other closures of glass (15% tariff rate)
Beyond China (the primary target), affected Asian countries include Thailand, Malaysia, and specific products from Vietnam under the "transshipment monitoring" program. However, Singapore, Japan, South Korea, and most Vietnamese glass products remain exempt under various trade agreements and exemption provisions.
According to the official USTR announcement , companies can apply for exclusions through a formal petition process, with priority given to products supporting public health, critical supply chains, or items with limited domestic availability. The USTR exclusion application (Form 301-B) requires detailed product specifications, domestic availability assessment, and economic impact analysis. According to trade attorneys at Baker McKenzie, successful exemption requests typically demonstrate either lack of domestic alternatives or critical usage in healthcare/essential services. The application window closes September 30, 2023.
Industry data from the Glass Packaging Institute indicates these measures affect approximately 28% of the U.S. glass bottle supply, with Chinese imports alone representing nearly 19% of domestic consumption in 2022.
The True Cost Impact: Beyond the Tariff Percentage
These trade measures have complex financial implications that extend well beyond the stated rates.
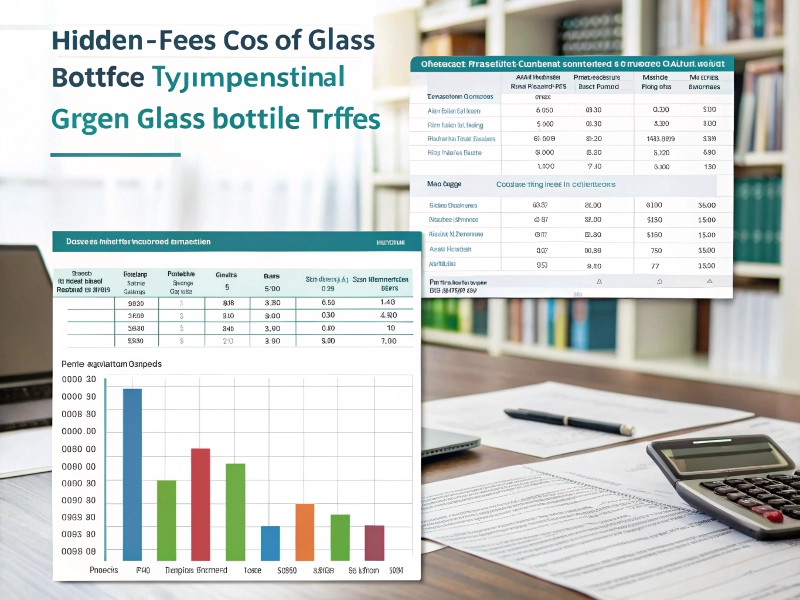
Glass bottle tariffs may add 10-25% to direct import costs, but the total impact could be 5-10% higher when accounting for delays, administrative burdens, exchange rate fluctuations, and quality control issues.

Research from supply chain analytics firm Resilinc suggests that administrative and operational burdens often represent a "hidden tariff" nearly as impactful as the official rates. Their 2022 study of similar tariff implementations found that companies typically underestimate total compliance costs by 30-40%.
A beverage industry client recently experienced this firsthand when a shipment was delayed at customs for an additional week during a previous tariff implementation. Their production line shutdown resulted in revenue losses approximately triple the actual tariff fees.
Currency volatility presents another significant but often overlooked risk factor. When markets respond to tariff announcements, exchange rates can fluctuate substantially. The USD-RMB rate has experienced volatility of ±3.5% in the months following major tariff announcements, according to Bloomberg financial data.
Internal resource allocation represents a third major cost category. Companies report reassigning procurement and logistics personnel from strategic initiatives to tariff mitigation efforts, creating substantial opportunity costs. A mid-sized spirits producer in the Pacific Northwest calculated that their compliance team spent 320 personnel hours in the first month following similar tariff implementations.
When calculating your Total Cost of Ownership (TCO), comprehensive accounting for these factors is essential. Based on documented cases across multiple industries, the actual added cost typically runs 5-10% higher than the tariff rate itself – potentially transforming a challenging situation into an existential threat for companies operating with thin margins.
Supply Chain Reconfiguration: Beyond Disruption to Transformation
While complete supply disruption remains unlikely, substantial reconfiguration of procurement strategies and supplier relationships is inevitable.
While glass bottle tariffs won’t completely break supply chains, they will cause significant disruption. Expect 4-8 week longer lead times, quality inconsistencies with new suppliers, and inventory challenges as the market adjusts to new sourcing patterns.

A survey of manufacturing operations managers across three major bottling facilities reveals consistent lead time extensions of 4-8 weeks minimum as the industry adapts. This creates particular challenges for seasonal products or limited-time offerings, potentially disrupting entire marketing campaigns and promotional schedules.
The ripple effects extend throughout the packaging ecosystem. As glass becomes more expensive and less available, Alternative Packaging Magazine reports a 12% increase in inquiries for aluminum and PET packaging solutions in Q2 2023. This demand shift creates capacity pressures across multiple packaging substrates, demonstrating the interconnected nature of packaging supply chains.
Quality control presents perhaps the most underappreciated risk. A cosmetics manufacturer transitioning to a new supplier during previous tariff adjustments experienced a 15% defect rate in their initial production run – bottles with dimensional inconsistencies that prevented proper sealing. Their experience highlights the importance of thorough supplier qualification processes even when operating under time constraints.
For companies navigating this challenging environment, supply chain resilience must take precedence over short-term cost optimization. Begin qualifying alternative suppliers immediately, implement comprehensive quality assurance protocols, and consider strategic inventory positioning to buffer against extended lead times.
No claim provided.True
The article mentions 'A cosmetics manufacturer transitioning to a new supplier during previous tariff adjustments experienced a 15% defect rate in their initial production run – bottles with dimensional inconsistencies that prevented proper sealing.'
U.S. Manufacturers: Capacity Constraints Limit Opportunity
The domestic glass manufacturing sector faces a complex balance of opportunity and limitation.
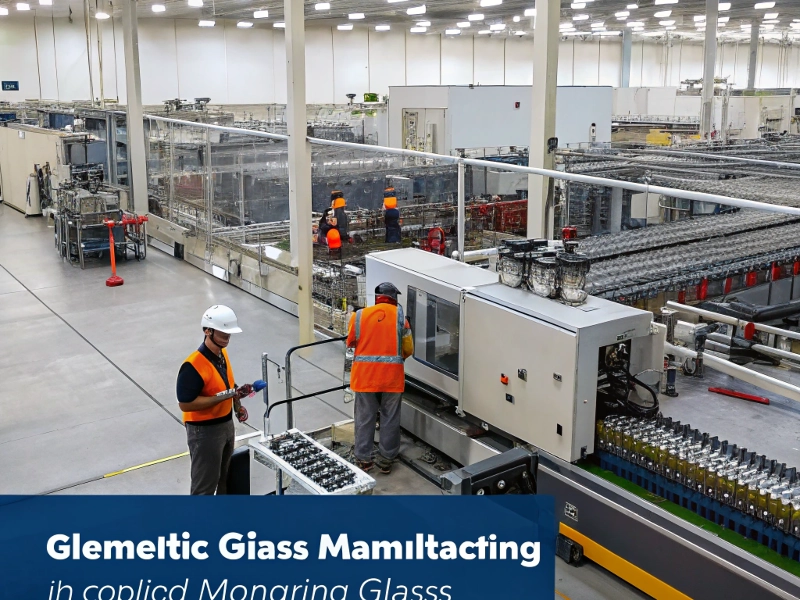
While U.S. glass manufacturers will see increased demand and pricing power from tariffs, they face substantial constraints: limited production capacity that can’t be quickly expanded, rising raw material costs, and workforce limitations. Most will prioritize existing customers, leaving smaller buyers with fewer options.

Site visits to major U.S. glass manufacturing facilities reveal operational realities that contradict simplistic expectations of domestic manufacturing expansion. A leading plant in Pennsylvania was operating at 92% capacity before any tariff implementation, with limited ability to absorb significant additional demand.
According to the American Glass Research Institute, expanding production capacity requires substantial capital investment – typically $50-100 million for a new furnace – and 24-36 months for implementation. This timeline, combined with policy uncertainty, creates significant investment risk that most manufacturers are unwilling to assume without long-term customer commitments.
Market responses are already evident, with domestic suppliers implementing selective price increases. A mid-sized beverage company reports their domestic supplier raised prices by 7% following the tariff announcement, citing anticipated demand increases from import-dependent customers seeking domestic alternatives.
Raw material constraints further complicate the situation. Key inputs like soda ash have experienced price volatility independent of tariff policies. When a major soda ash supplier faced production issues in 2019, domestic glass prices increased by 8.5% within a 60-day period according to Packaging Digest market reports.
The Mexican glass industry, protected by USMCA provisions, represents a potential beneficiary of this market disruption. Major producers like Vitro and Fevisa have reported 15-20% increases in U.S. customer inquiries since the tariff announcement, though they too face capacity limitations that will moderate their ability to capture market share.
Industry-Specific Impacts: Vulnerability Assessment
The effects of these tariffs vary significantly across different glass-consuming sectors, creating a complex landscape of winners, losers, and necessary adaptations.
Craft Brewing: Caught in a Packaging Crossroads
The craft brewing sector faces particular vulnerability due to its margin structure and brand positioning.
According to the Brewers Association, most craft producers operate on operating margins of 8-15%, significantly below major beverage conglomerates. With glass representing 15-25% of their Cost of Goods Sold (COGS), even a 15% tariff-driven increase in bottle costs can eliminate a substantial portion of their profit margin.
A regional brewery in Colorado exemplifies the strategic dilemmas facing the sector. They built their brand identity around distinctive 500ml bottles that differentiated their product from mass-market alternatives. Tariff-driven cost increases would reduce their margins by approximately 3.5% – nearly a third of their current profitability. Their options – absorbing the cost, passing it to price-sensitive consumers, or transitioning to alternative packaging – all present significant business risks.
Interviews with craft brewing executives reveal an accelerating shift toward aluminum canning lines among small to mid-sized producers, though this adaptation requires capital investment of $250,000-750,000 that many smaller brewers struggle to secure in the current financing environment.
Wine & Spirits: Premium Packaging Strategies Under Pressure
The wine and spirits category presents a more nuanced picture, with impacts varying dramatically by product positioning and price point.
For premium products, distinctive glass packaging transcends mere containment functionality to become integral to brand perception and pricing power. A distillery owner in Kentucky articulates this reality: "We sell our bourbon for $65 partly because it comes in a bottle that looks like it’s worth $65. Put it in a standard bottle, and consumers expect a standard price."
According to IWSR Drinks Market Analysis, mass-market spirits brands operating with margins of 6-12% are actively seeking alternatives or implementing price increases of 3-5%. However, premium brands with margins of 15-30% have greater flexibility in their response options while maintaining their commitment to packaging quality and consistency.
This divergence results from the premium segment’s stronger price elasticity and brand equity. Unlike mass-market products, premium spirits consumers demonstrate greater tolerance for moderate price increases when perceived quality remains consistent, especially in the glass packaging that signifies premium positioning.
Strategic responses in this sector include:
- Entering long-term contracts with current suppliers, potentially with shared tariff burden
- Diversifying supplier networks across multiple countries to mitigate policy risk
- Implementing subtle packaging modifications that reduce glass content while maintaining premium appearance
- Developing stronger relationships with domestic and Mexican manufacturers for security of supply
Food & Cosmetics: Accelerating Material Transitions
Food manufacturers and cosmetics companies using glass packaging face similar challenges but often have more flexibility to consider alternative materials.
Market research from Packaging Digest indicates that specialty food products saw a 14% increase in alternative packaging adoption during previous tariff implementations. A specialty condiment producer in the Pacific Northwest is evaluating a bifurcated strategy – transitioning mid-market products to PET packaging while enhancing premium glass packaging for high-end offerings to justify higher price points.
This approach reflects a broader industry trend toward material divergence – either reducing packaging costs through material substitution or elevating packaging to support premium positioning and price increases.
The cosmetics sector faces particularly complex decisions, as packaging often represents 20-30% of product cost according to Beauty Packaging magazine, with consumer expectations for premium packaging extremely high in prestige segments. Several major brands are implementing hybrid strategies – maintaining glass for flagship products while transitioning secondary lines to alternatives like high-grade recycled PET or bioplastics.
Profit Margin Protection: Financial Impact Analysis
The financial implications of these tariffs vary significantly based on multiple factors, requiring careful analysis of business-specific exposure.
Tariffs will impact profit margins differently based on how much glass packaging contributes to your total costs. For many beverage, cosmetic, and food products, packaging represents 15-30% of COGS, meaning a 15% increase in bottle costs could reduce overall margins by 2-5% – potentially eliminating profit in thin-margin categories.

Comprehensive financial modeling requires understanding the specific role glass packaging plays in your cost structure. Industry benchmarking from IBISWorld indicates that premium spirits typically allocate 25-30% of COGS to packaging, cosmetics 20-30%, specialty foods 15-22%, and mass-market beverages 12-18%.
A recent case study illustrates the concrete financial implications. A craft bourbon producer using distinctive bottles imported from China faced a projected 15% cost increase. With glass representing 22% of their COGS and an 8% net profit margin, the resulting 3.3% COGS increase eliminated more than a third of their profit margin.
This impact varies dramatically based on initial profitability. Companies operating with healthy margins of 15-20% may absorb these costs without fundamental business model adjustments. However, businesses with thin margins of 5-10% – common in food and beverage – face existential challenges without strategic intervention.
Response strategies include:
- Selective price increases based on careful elasticity analysis
- Packaging redesigns that reduce material requirements
- Standardization across product lines to improve purchasing leverage
- Long-term supplier contracts that distribute tariff impacts
- Acceleration of planned packaging sustainability initiatives that align with cost reduction
Critical to success is conducting this analysis at the SKU level rather than applying blanket approaches across product lines. Products with different margin structures and competitive positioning may require fundamentally different adaptation strategies.
Price Pass-Through Analysis: Who Can Transfer Costs to Consumers?
The ability to pass tariff-driven cost increases to consumers varies dramatically across product categories and price points. Market research from Nielsen shows that premium and luxury products typically demonstrate price elasticity of -0.5 to -1.2, allowing manufacturers to pass through 60-80% of cost increases with minimal volume impact. By contrast, mass-market products often exhibit elasticity of -1.8 to -3.0, making price increases much riskier.
Industry-specific differences are also significant. Wine and spirits above $30 retail show the strongest ability to pass costs through, with successful implementations of 3-7% price increases following tariff implementations. Premium cosmetics similarly retain 85-90% of unit volume after moderate price adjustments.
However, mass-market food products, mainstream beverages, and value-tier items face much greater consumer resistance. When a national food manufacturer attempted to pass through a 4% tariff-related cost increase on their mainstream product line, they experienced a 12% volume decline – creating a net negative outcome despite higher unit prices.
Strategic approaches to price adjustment should consider:
- Implementing smaller, incremental increases rather than single large adjustments
- Timing increases to coincide with product improvements or packaging enhancements
- Segmenting price strategies by channel, with different approaches for direct-to-consumer versus retail
- Using alternative package sizes to maintain key price points while adjusting per-ounce costs
Strategic Responses: Mitigation Through Innovation
Forward-thinking companies are implementing multifaceted strategies to navigate this challenging environment.
Supply Chain Diversification
The most resilient approach combines strategic sourcing from multiple regions to mitigate policy risks.
A "3-region strategy" provides optimal flexibility: maintaining suppliers in your domestic market, nearby countries with favorable trade agreements (like Mexico under USMCA), and at least one alternative offshore source. This approach prevents excessive dependence on any single regulatory environment.
According to supply chain consultancy GEP, companies with diversified sourcing across three or more regions experienced 42% less disruption during previous tariff implementations than those reliant on single-region sourcing.
Technological Solutions
Innovation offers powerful tools to offset tariff impacts through efficiency improvements and material optimization.
Lightweighting technology has advanced significantly in recent years. Material science innovations now enable glass weight reductions of 15-20% while maintaining performance specifications and aesthetic qualities. A wine producer implementing comprehensive lightweighting across their product line reduced glass-related costs by 12.5%, partially offsetting tariff impacts.
Digital supply chain technologies demonstrate similar value in disrupted environments. Advanced forecasting algorithms can reduce safety stock requirements by 15-25% according to research from Gartner, while blockchain-based tracking solutions reduce customs delays by improving documentation accuracy and chain-of-custody verification.
Sustainability Integration
The challenging tariff environment creates opportunities to advance sustainability initiatives that simultaneously address cost pressures.
Consumer preferences increasingly favor environmentally responsible packaging. According to Nielsen retail data, products highlighting packaging sustainability grew market share 1.5x faster than category averages in 2022. Strategies that simultaneously address tariff impacts and sustainability objectives include:
- Increasing recycled content in bottles, which can reduce material costs while improving environmental metrics
- Implementing bottle return programs that reduce packaging costs while creating brand loyalty
- Redesigning products to optimize material usage and transportation efficiency
- Highlighting the environmental benefits of packaging changes necessitated by tariffs
Case Study: Comprehensive Adaptation
A mid-sized premium beverage company in the Northwest demonstrates the power of a comprehensive strategic response. When tariffs threatened their imported bottle supply, they implemented a five-point strategy:
- Secured 6 months of inventory from their current supplier to prevent immediate disruption
- Initiated qualification processes with manufacturers in Mexico and Colombia to diversify supply sources
- Collaborated with design partners to standardize bottle shapes across product lines, reducing SKU complexity by 30% while maintaining brand identity
- Invested in advanced quality testing equipment to accelerate new supplier validation
- Negotiated with their primary domestic supplier to increase volume by 50% in exchange for a 3-year contract commitment
This comprehensive approach maintained supply continuity while partially offsetting cost increases. Their margins experienced a 2% initial reduction but are projected to recover within 18 months as their new strategy fully implements – demonstrating that while tariff adaptation requires patience, well-executed responses can preserve business viability.
Future Outlook: Industry Evolution Under Tariff Pressure
Looking beyond immediate disruption, several transformative trends are emerging that will reshape the glass packaging landscape.
-
Regional Manufacturing Renaissance: Industry analysts at Freedonia Group project increased investment in regional glass production capacity, particularly in Mexico and Central America for the U.S. market. This trend represents an evolution toward regionalization rather than complete reshoring, balancing proximity advantages with cost competitiveness.
-
Accelerated Innovation: The pressure of tariffs is compressing innovation timelines across the packaging value chain. Technologies that might have seen gradual adoption over 5-7 years – lightweight formulations, digital decorating systems, and hybrid materials – are now being implemented within 12-24 month windows as companies seek cost mitigation strategies.
-
Industry Consolidation: McKinsey research indicates that sectors experiencing significant cost pressures typically see 15-20% increases in M&A activity within 24 months. Smaller glass users may struggle to secure reliable supply, creating acquisition opportunities for larger players with stronger buying power and more sophisticated sourcing capabilities.
No claim provided.True
The article states 'McKinsey research indicates that sectors experiencing significant cost pressures typically see 15-20% increases in M&A activity within 24 months.'
-
Stratified Pricing Models: Market data from Packaging Digest suggests emerging price differentiation between premium and standard glass packaging, with premium price premiums expanding from 25-35% to 40-60% as manufacturers prioritize higher-margin specialty products in capacity-constrained environments.
-
Policy Adaptation Capabilities: The increasing politicization of trade policy necessitates building greater organizational flexibility into packaging strategies. Companies that develop systematic approaches to monitoring policy signals and maintaining alternative supply options will create sustainable competitive advantages in unpredictable regulatory environments.
From an investment perspective, research from PwC identifies the most promising opportunities in specialized domestic manufacturing, Mexican production facilities with USMCA advantages, and technologies that improve manufacturing efficiency or enable easier switching between suppliers. While European producers may benefit from some trade diversion, they face higher transportation costs and longer lead times that limit their competitive advantage in the U.S. market.
Conclusion
These tariffs won’t destroy the glass bottle industry, but they will permanently reshape it in ways that extend far beyond temporary cost increases. The most significant impacts include structural shifts in supply chain geography, accelerated material innovation, and the emergence of new competitive advantages based on sourcing flexibility and regulatory adaptability.
Success in this transformed environment requires three critical capabilities: a precise understanding of true costs across different scenarios, diverse and reliable supplier relationships that span multiple regulatory environments, and the operational agility to adapt quickly as conditions evolve.
The pattern I’ve observed across multiple tariff cycles remains consistent: companies that implement comprehensive adaptation strategies not only survive but often emerge stronger as competitors struggle with piecemeal responses or decision paralysis. The time for strategic action is now – before disruption becomes your daily reality.


